Projections: where your accounts could be years from now
Start from today’s balances, add the contributions you plan, apply an assumed annual rate, and see each account year by year to the end of your plan.
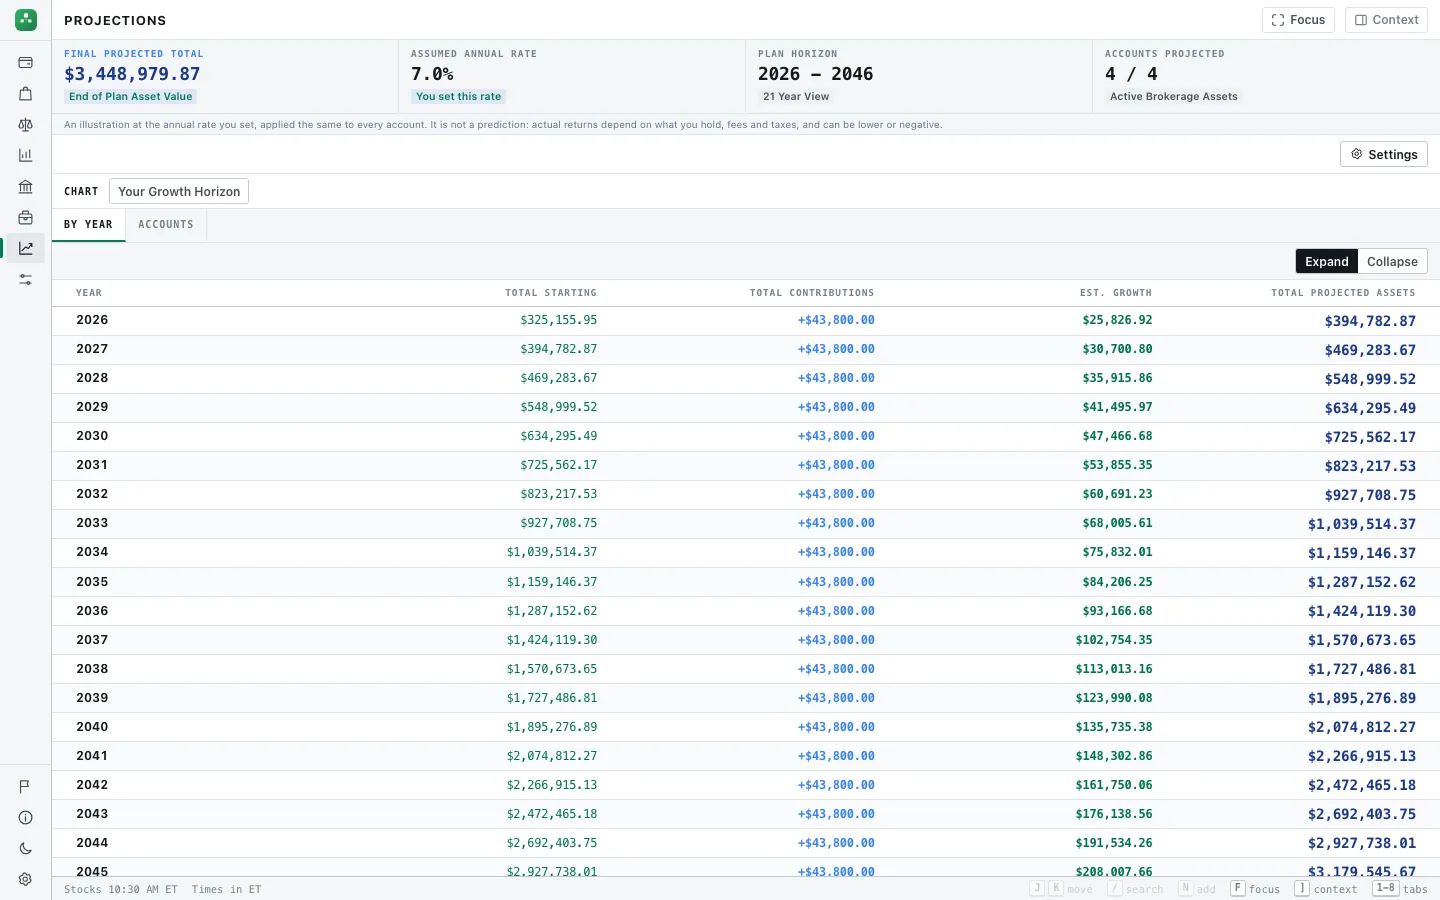
Year by year
The By year view lists every account for every year of the plan, with contributions and growth. The Your Growth Horizon chart ends at the same total as the Final Projected Total card.
Assumptions you control
The assumed annual rate is 7% until you change it, applied the same to every account. Each account has its own contributions, and any single year can be overridden. It is an illustration, not a prediction, and the tab and PDF say so.
Where the numbers come from
Starting balances come from your Brokerage accounts; contributions and the horizon come from you. The Dashboard and the Net Worth Report use the same projection.
Free and paid
Free, by hand
- Every account, assumption and year override
Paid, with bank connections and AI
- Starting balances follow your connected accounts
Try it with your own numbers
Free when you enter figures by hand. Bank connections through Plaid and the AI tools are $8 a month, or $80 a year (2 months free). No card needed to start.